

10× revenue growth. A $10 million Series A.
Axle Health’s founder reported both in May 2025. But the slide worth opening is the one about customers staying. Original reporting and deck.
An impressive growth number earns a question: what is underneath it?
That is the useful way to read a modern AI pitch deck. Find the evidence that makes the headline believable—and the next question it leaves unanswered.
Below are three recent software fundraising decks, with the exact slides to inspect and a practical audit for your own pitch. Start with the table. The contrast between the last two examples is the part to pay attention to.
Three AI startup pitch decks to study for a 2026 raise
| Company / model | Round announced | Deck shared publicly | Open this first |
|---|---|---|---|
| Axle Health · B2B healthcare software | $10M Series A · May 2025 | May 22, 2025 | Deck: slide 7, retention |
| Charta Health · B2B healthcare AI | $8.1M Seed · February 2025 | February 26, 2025 | Deck: slide 8, customer outcomes |
| Vybe · AI internal-app builder | $10M Seed · December 2025 | February 12, 2026 | Deck: Enterprise Pipeline |
These are 2025 rounds, with public deck coverage from 2025–2026—not three rounds raised in 2026. Vybe’s founder announcement establishes its December date. Each deck link goes to Business Insider’s original reporting and company-supplied slides; publisher access requirements can vary. We inspected the public versions, not private investor data rooms.
Download the pitch-proof audit if you want to work on your deck alongside the examples.
1. Axle: what happens after the customer signs?
Slide 7 reports 121% annual net revenue retention, alongside a cohort table and customer testimony. That is a different claim from acquiring more customers: it asks the reader to examine the existing base. The figures are company-reported, not independently audited here. Inspect the slide in the original deck.
Your audit: can someone distinguish new-customer revenue from expansion, contraction and churn in your pitch? Put the measurement period and cohort definition beside the number. A total revenue curve cannot answer every retention question.
2. Charta: what changes for the customer?
Charta’s case-study slide reports 12.6% higher primary-care revenue for one customer example and $1.1M in annual revenue capture for another. These are customer outcomes claimed in the deck, not Charta’s own ARR. Open slide 8.
Your audit: write the before-and-after outcome for one customer. Add the period, baseline and method. Name what else changed. A savings estimate, an observed result and an annualized projection need different labels; avoid quietly turning one into another.
3. Vybe: read the small print under the big numbers
Vybe’s Enterprise Pipeline slide explicitly labels its figures as projected annual revenue. That makes it a useful example of opportunity sizing, not realized sales. The public deck also has one slide removed and another redacted. Original deck and disclosure.
Your audit: separate conversations, commitments, signed contracts and recognized revenue. Then show which assumption connects each stage to the next. If a spreadsheet multiplies seats by a price, the output is a scenario until customers actually buy.
The same dollar sign hides three different claims
All three are recent. All three accompany funded rounds. They still do not offer an interchangeable definition of traction.
One directs attention to an existing customer base. Another makes the customer’s economic outcome concrete. A third explicitly distinguishes a projected opportunity. Treating all those numbers as equivalent would erase the very thing worth learning.
Match the example to the uncertainty in your business. A founder proving initial demand needs a different argument from one proving that acquisition and retention repeat. A beautifully presented forecast cannot substitute for operating history when the claim requires operating history.
An original reading framework, not a ranking of the companies or a universal investor scorecard.
Does an AI startup need 9× growth to raise in 2026?
There is no single threshold established by these examples. An investor’s expectation depends on the stage, starting revenue, business model and opportunity they are underwriting. Ask what their growth number measures before comparing it with yours.
The bar has moved in parts of AI. Bessemer’s August 2025 research studied 20 selected high-growth AI companies and proposed a quadruple–quadruple–triple–triple–triple trajectory for its “Shooting Stars.” It also emphasizes retention, margins and capital efficiency. This is a selected breakout cohort, not a minimum admission requirement for every startup. Bessemer’s State of AI.
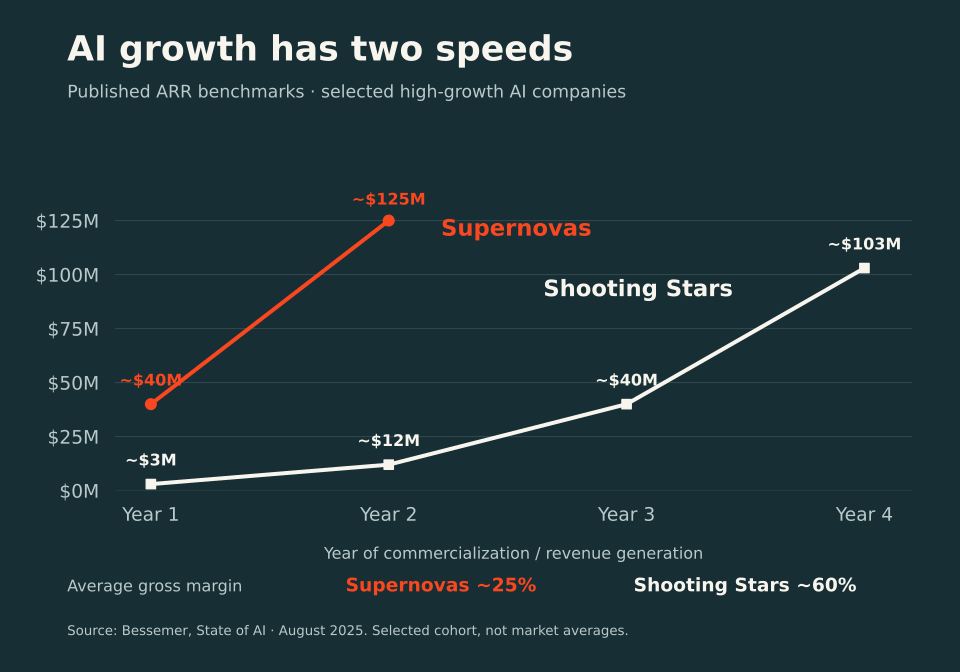
The faster curve comes with a much lower reported average gross margin. That is why “how fast?” belongs beside “at what cost?” in your pitch.
CRV’s July 2026 Series A guidance reinforces the distinction: investors need operating evidence and repeatable acquisition, with different expectations for AI-native companies. CRV’s Series A guide.
If an investor asks for 9×, clarify the starting base, period and revenue definition. Then ask what durability and efficiency must accompany that growth. The resulting conversation is more useful than adding a steeper arrow to your deck.
Turn the examples into a better pitch
Before changing your slide design, run this audit. It is our suggested workflow, not a tested fundraising formula.
| Your headline claim | Evidence to place beside it | Question to prepare for |
|---|---|---|
| We are growing fast | Beginning and ending revenue, dates, definition and customer concentration | How much came from new customers versus existing ones? |
| Customers love it | Cohort usage and retention, including customers who stopped | Does the pattern survive beyond the first enthusiasts? |
| Our AI saves money | A measured customer baseline, the new cost and the measurement method | Does the saving include implementation and human review? |
| We have a huge pipeline | Opportunity stages, next steps and explicit conversion assumptions | Which opportunities are contracts, and which are conversations? |
| We can scale | Acquisition results, delivery costs and capacity constraints | What becomes harder as volume grows? |
| This round changes the business | Specific milestones, spending assumptions and a fallback plan | What uncertainty will the capital resolve? |
Try a 20-minute proof pass:
- Five minutes: highlight every number in your deck. Mark it observed, committed or projected. Flag any that does not fit cleanly.
- Ten minutes: pick your three biggest claims. Add a source, date and definition to each. Write the strongest reasonable objection underneath.
- Five minutes: choose the missing evidence that would most change the investment argument. Give its collection an owner and a deadline.
Download the editable audit. It includes a blank evidence register and a worked, explicitly hypothetical example showing how a pipeline estimate can be mistaken for ARR.
Our verdict
Study these decks for the questions they help you answer. Build your pitch around evidence you can defend.
| Your immediate problem | Start with | Leave with |
|---|---|---|
| A growth story without a clear retention story | Axle’s retention slide | A definition of what happens to existing customers |
| A product story without a concrete customer result | Charta’s case-study slide | A measurable before-and-after claim |
| An opportunity story that could be mistaken for traction | Vybe’s pipeline slide | A clear boundary between forecasts and results |
A deck cannot supply missing traction. It can make the traction you have—and the uncertainty you still face—much easier to inspect.
After the meeting, those claims have to survive a second reading. The investor-update template is where a number either stays consistent or gets corrected. If the deck is for a program, the accelerator directory is the list of deadlines, attendance, and terms to check before you apply. A customer logo is not a paid test; the paid pilot directory separates the two.
Sources, dates and limitations
Reviewed September 25, 2026. We checked the original publisher’s reporting and visually inspected the featured slides. We selected three software examples for different evidence types, not because they represent the whole funding market. Two are healthcare companies, so this is deliberately a small reading list, not a broad sector benchmark.
The dates above distinguish round announcements from public deck publication; they do not establish the exact date each slide was created or which version every investor saw. Public decks may omit information supplied during diligence. Company-reported metrics are not independently verified, and successful fundraising does not prove that a slide caused the investment.
We link to the published decks and do not redistribute their slides. Our cover is an original conceptual illustration; the audit and verdict are Cerrito’s synthesis. No interviews with these founders or fundraising experiment were conducted for this article.